Introduction
For this project we will examine the 10 largest freshwater lakes by surface area. Our data was collected from World Atlas. We used Wikipedia to fill in missing values and double check our result. For this project we will be using the here package and ggplot2 package.
library(here)
library(ggplot2)
Examining our data structure
Our first order of business is to load in our data. We do this below.
fwl <- read.csv(here("csv", "freshwater_lakes.csv"))With our data ready, we examine the structure with the str function. We are working with a data.frame with 10 observations and 9 variables. We will not use all of the variables, however, it is worthwhile to note that surface area and volume are measured in \(km^2\) and \(km^3\) respective while the other numerical values are measured in meters.
str(fwl)## 'data.frame': 10 obs. of 9 variables:
## $ rank : int 1 2 3 4 5 6 7 8 9 10
## $ name : chr "Lake Superior" "Lake Victoria" "Lake Huron" "Lake Michigan" ...
## $ continent : chr "North America" "Africa" "North America" "North America" ...
## $ surface_area: int 82103 59947 59588 58030 32900 31722 31153 29600 27200 25667
## $ volume : num 12000 2424 3543 4900 18900 ...
## $ length : int 560 359 332 494 673 636 NA NA 469 388
## $ max_width : int 260 337 295 190 72 79 NA 75 203 92
## $ max_depth : int 406 81 229 281 1470 1642 446 706 614 64
## $ avg_depth : num 147 41 59 85 570 ...Ploting Data
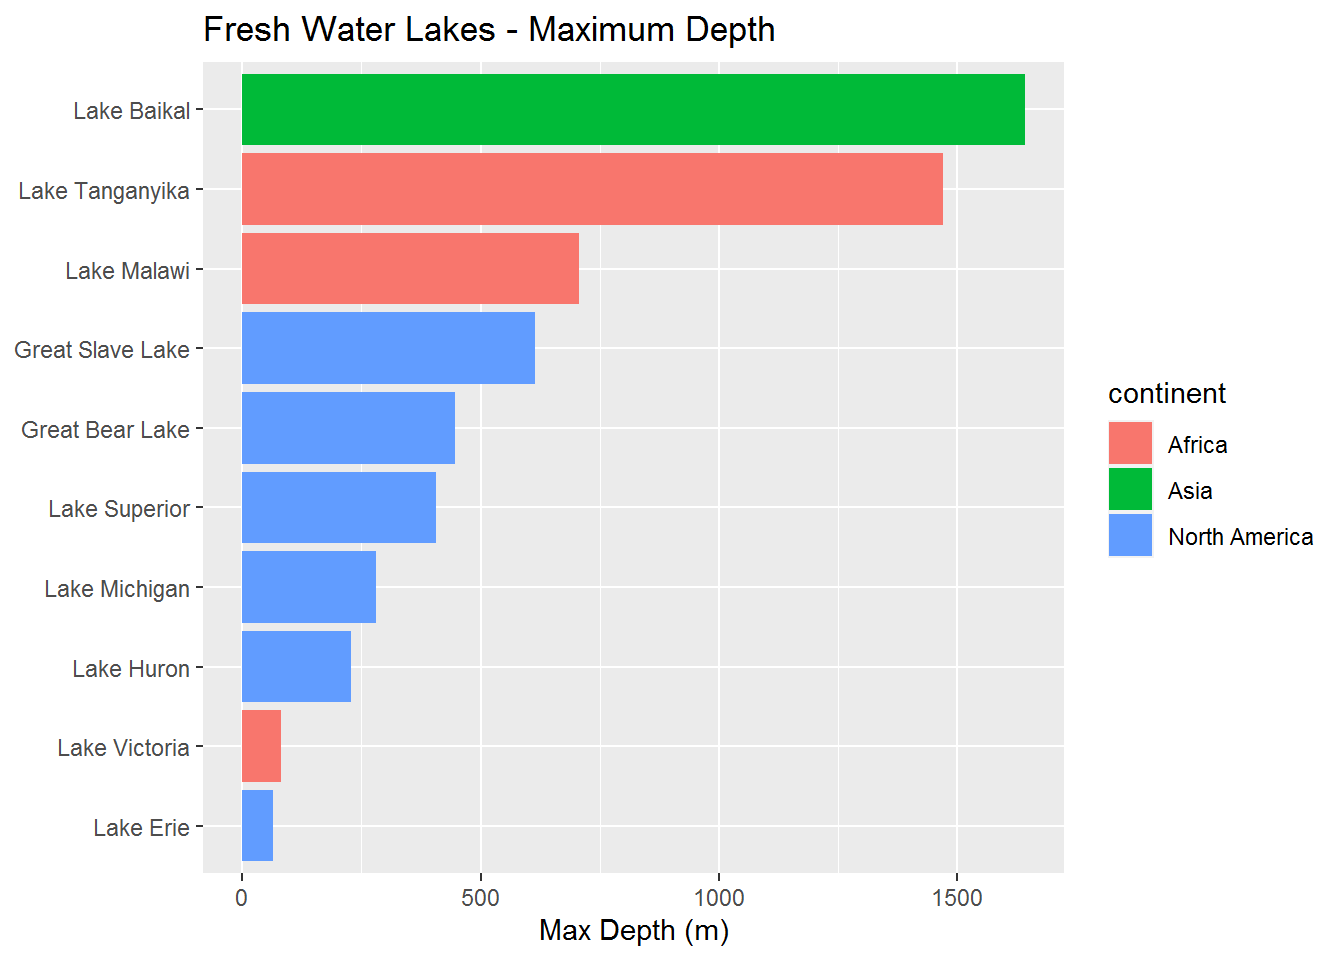
Now that our data is ready, we utilize ggplot2 to make some simple, but attractive plots. In this section we will look at the surface area, the volume and finally the maximum depth of the lakes and sort them largest to smallest.
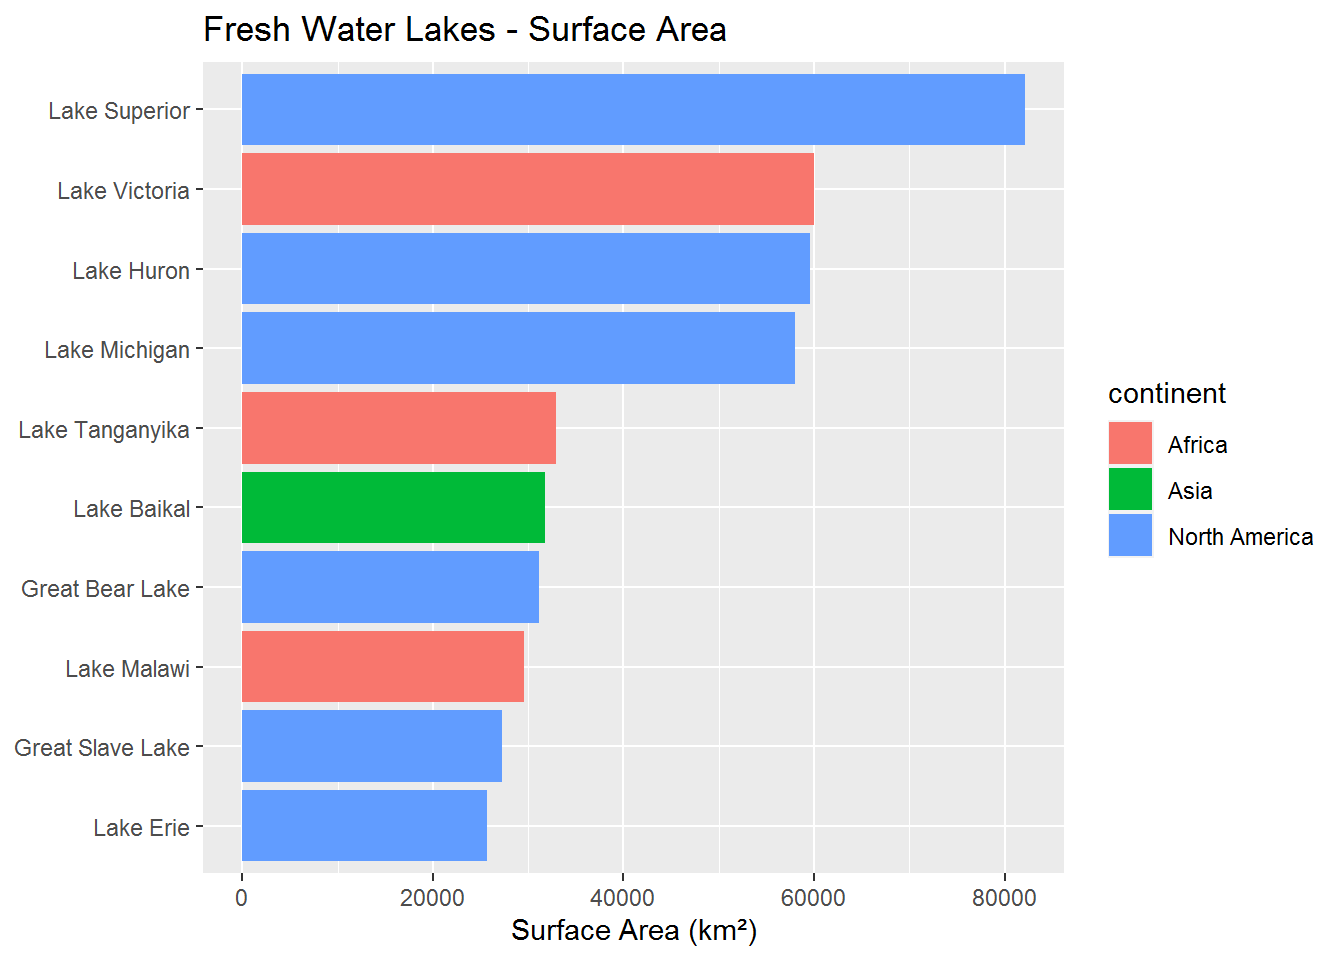
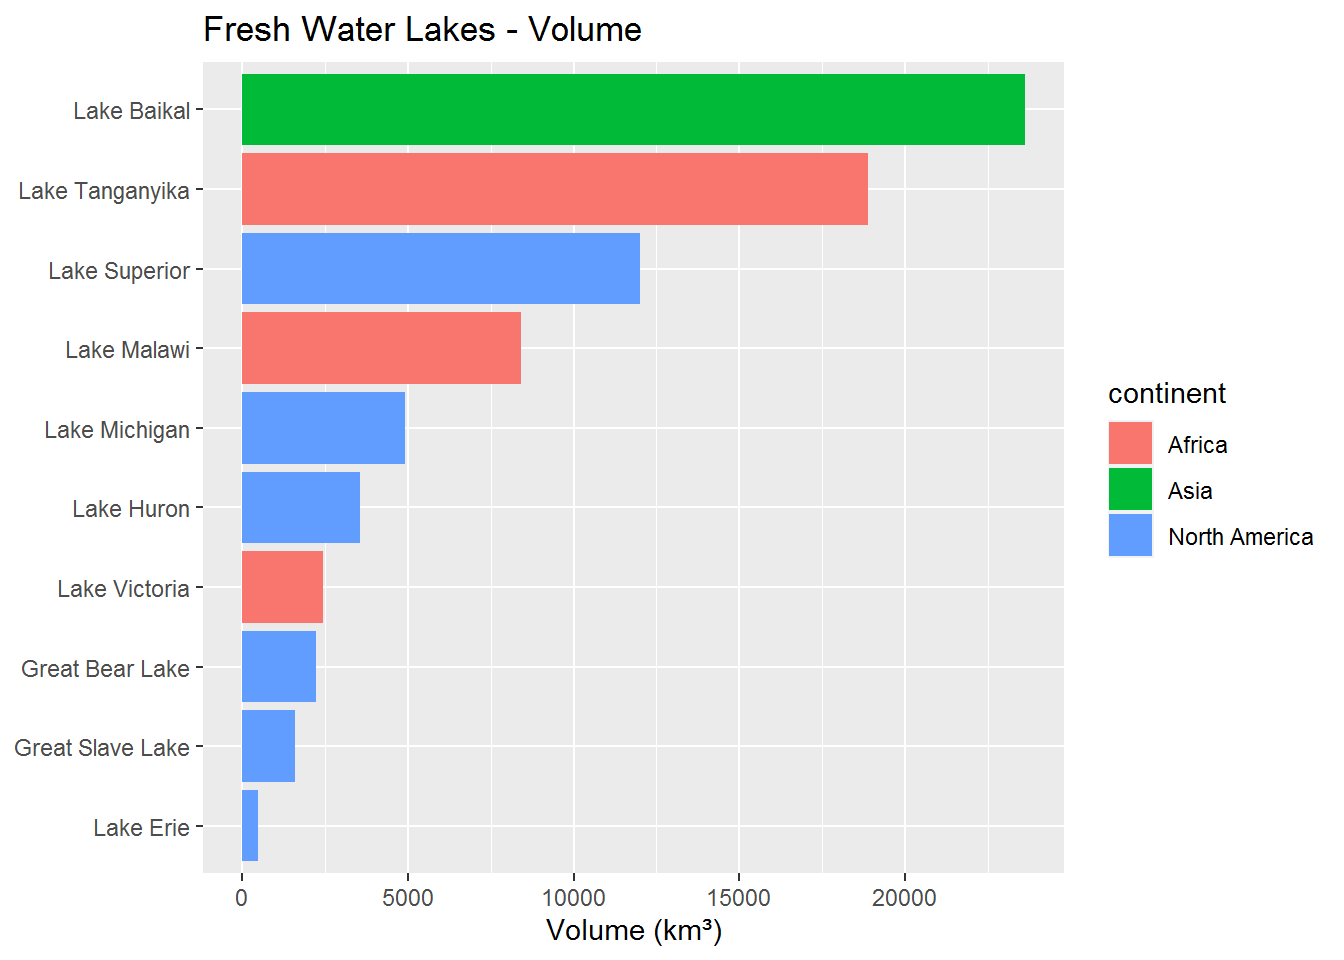
The results from these graphs show us that Lake Superior has the largest surface area, however, it only comes in third for volume. Perhaps more interesting is that Lake Baikal is ranked 6 for surface area, but has a significant lead in volume.
Examining Correlation
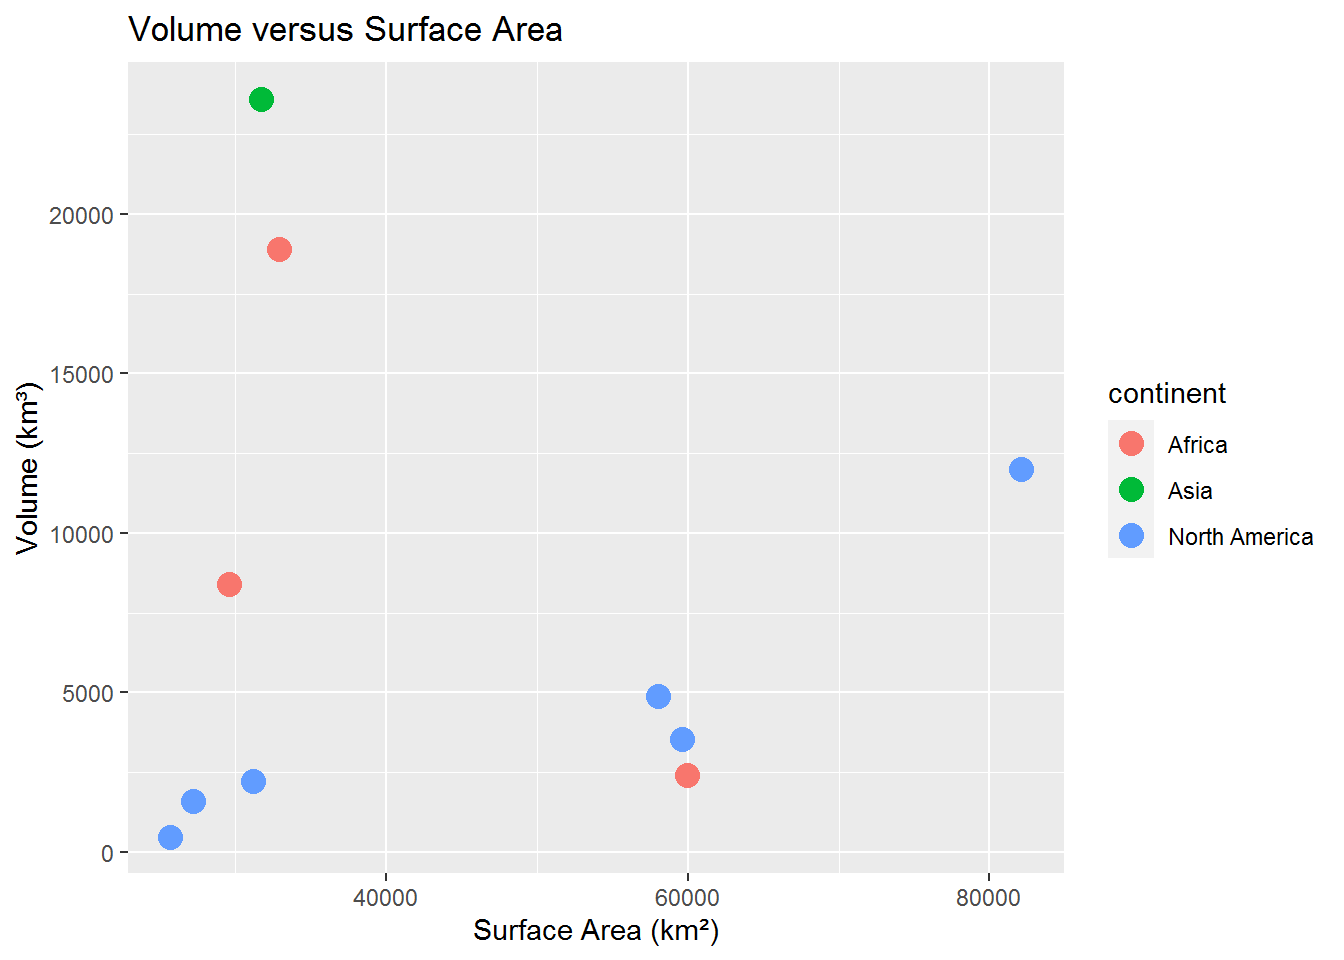
Looking at the graphs in the previous section there does not seem to be much correlation between volume and surface area. There does, however, appear to be a relationship between volume and maximum depth. Let’s examine these relationships. We first look at the correlation between surface area and volume.
sa_v_cor <- cor(fwl$surface_area, fwl$volume)We get a correlation of -0.0348471 indicating effectively no correlation between surface area in volume. We also graph the values below and our result appears to back up our calculation.
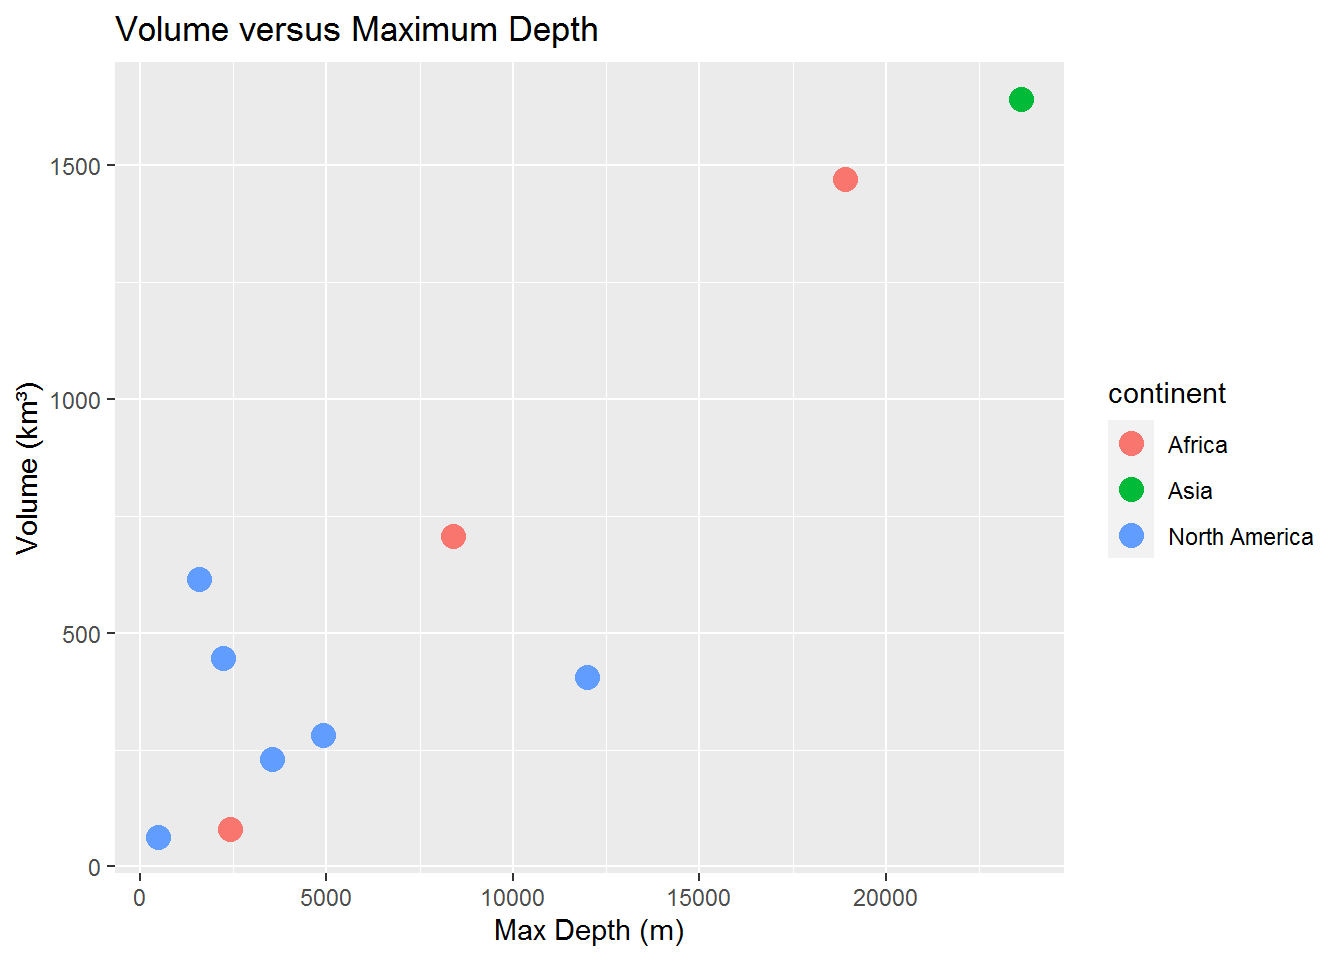
We now calculate the correlation of volume against the maximum depth.
v_md_cor <- cor(fwl$volume, fwl$max_depth)In this case we get a result of 0.8998485 indicating high correlation. We show this visually below.
Conclusion
Based on our results we can easily compare the largest lakes based on surface area. It should be noted that due the low correlation between surface area and volume (at least for these lakes) our list likely does not include the top 10 freshwater lakes by volume. Note that Lake Baikal is the deepest freshwater lake in the world. Also, while we see almost no correlation between surface area and volume for these lakes, we will likely see a different result if we include the top 100 or top 1000 lakes.
Overall, we conclude that our results are slightly biased towards freshwater lakes with large surface area. It is also worth noting that our correlation results may not represent the behavior of smaller lakes; this is perhaps the risk of working with potential outliers.