Introduction
In this project we will use 5 years of Walmart stock prices. The data was obtained from Yahoo Finance at https://finance.yahoo.com/quote/WMT/history?p=WMT. This project will be broken into two main parts. Our first goal is to examine daily returns. Our second goal is to forecast 100 weekdays into the future.
Since we are dealing with stock data we do not have information for the weekends. So everything we do is based on the weekday data. In our situation we will focus on the closing price for each day. We do not consider the adjusted close price in this project.
Section 1
Here we read our data into R and create a corresponding object of class xts.
walmart_stock <- read.csv(here::here("csv", "WMT_5Y_2020.csv"), as.is = TRUE)
walmart_stock$Date <- as.Date(walmart_stock$Date)
walmart_stock$Return <- c(NA, diff(walmart_stock$Close) /
                            walmart_stock$Close[-1] *  100)
# we will only use the close value not adjusted close
walmart_xts <- xts(x = walmart_stock[, -1],
                   order.by = walmart_stock[, 1])
We now plot our closing prices along various plots for daily returns.
plot(walmart_xts$Close, main = "Walmart Stock Daily Close Price")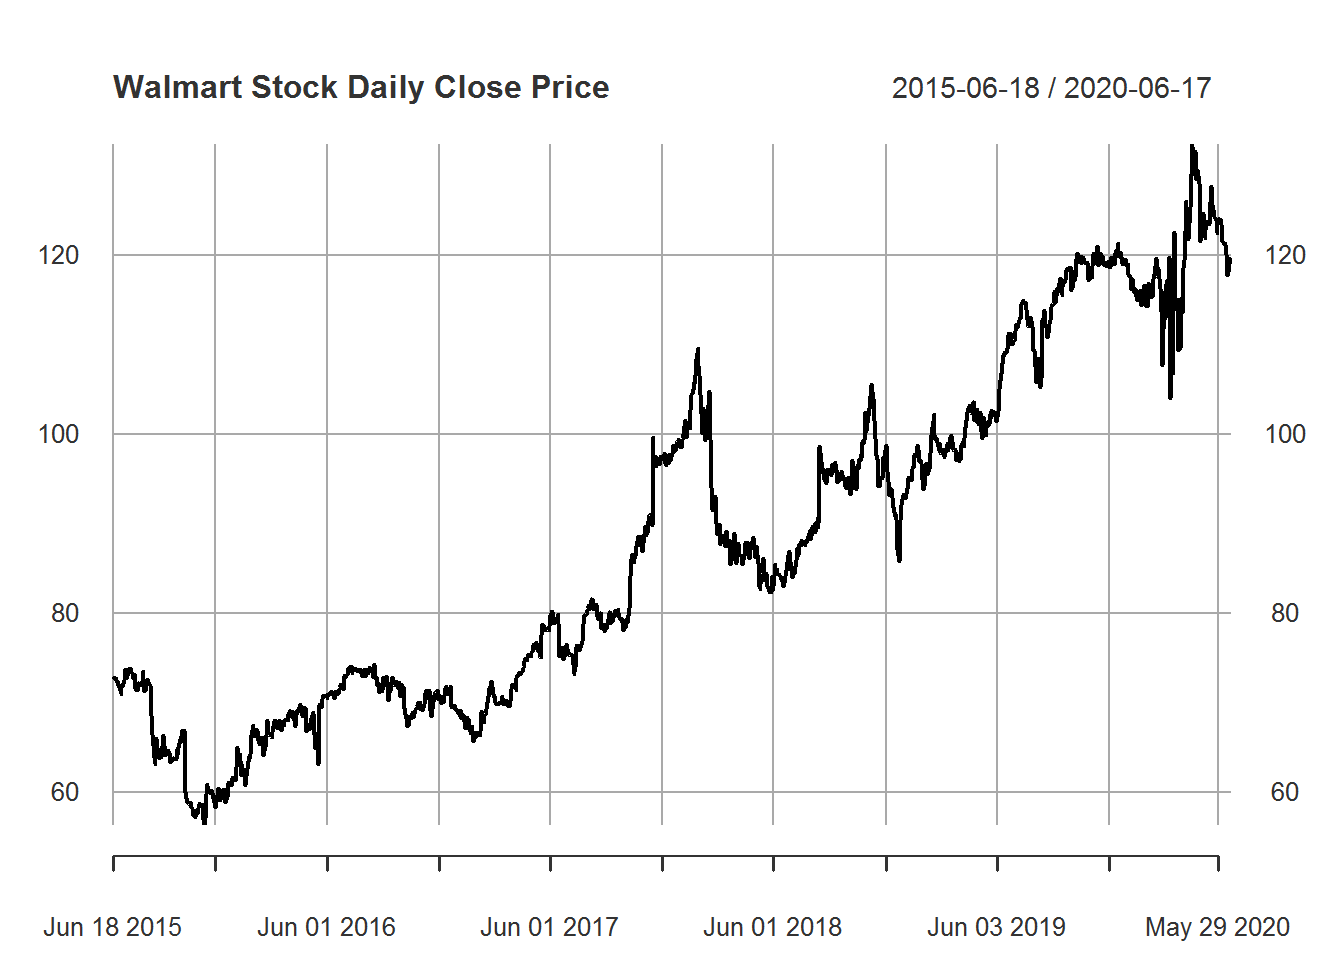
plot(walmart_xts$Return, main = "Daily Returns")
hist(walmart_xts$Return, breaks = 20, probability = TRUE,
     ylim = c(0, .5), main = "Walmart Daily Returns Distribution",
     xlab = "Return")
lines(density(walmart_xts$Return, na.rm = TRUE),
      lwd = 2, col = "red")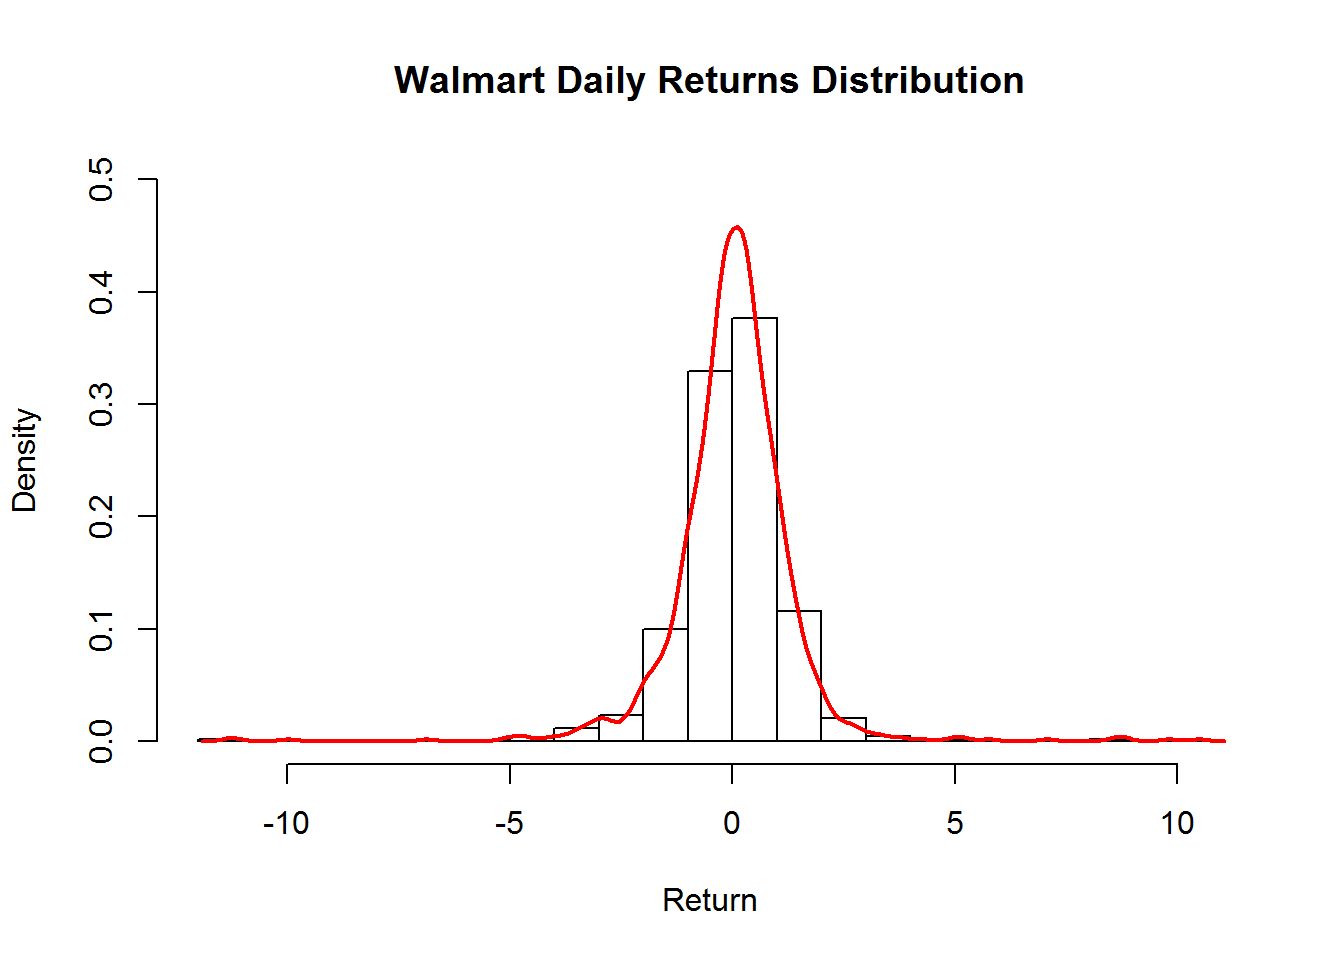
boxplot(as.data.frame(walmart_xts$Return), horizontal = TRUE,
        main = "Boxplot of Walmart Daily Returns")
Based on daily close prices it appears that Walmart stock prices have had a good return on investment over a long period of time. Additionally, we can see from our histogram that there are more positive daily returns than negative returns. Indeed we can calculate a median return of 0.0623 along with a mean return of 0.029. Overall it appears that Walmart stock is a good investment for both the short and long term. It should be noted, however, that Walmart stock does occasionally have extreme value changes. We will not investigate it further here, but this could be due to a variety of reasons including stock splits. We can also see that around March 2020 the returns are highly volatile.
Section 2
We now move on to forecasting. Since it is clear that our plot has trend we difference our data and plot the result.
d_wal <- diff(walmart_xts$Close)
d_wal <- d_wal[!is.na(d_wal)]
plot(d_wal, main = "Differenced Stock Close Prices")
From our graph it appears that the differenced closing prices are stationary. There is some concern about the increased variability in more recent observations, but this seems to have settled back to normal. We now look at the ACF and PACF for the differenced data.
par(mfrow = c(2,1), cex = 1)
acf(d_wal, main = "Differenced Closing Price")
pacf(d_wal, main = "")
Based on these results there does not appear to be any lag terms, however, there may some moving average terms. We consider ARIMA models with p = 0 lag terms, d = 1 differenced terms and vary our moving average term q from 0 to 1.
for (i in 0:1) {
fit <- arima(walmart_xts$Close, c(0, 1, i))
checkresiduals(fit)
}
##
##  Ljung-Box test
##
## data:  Residuals from ARIMA(0,1,0)
## Q* = 94.633, df = 10, p-value = 6.661e-16
##
## Model df: 0.   Total lags used: 10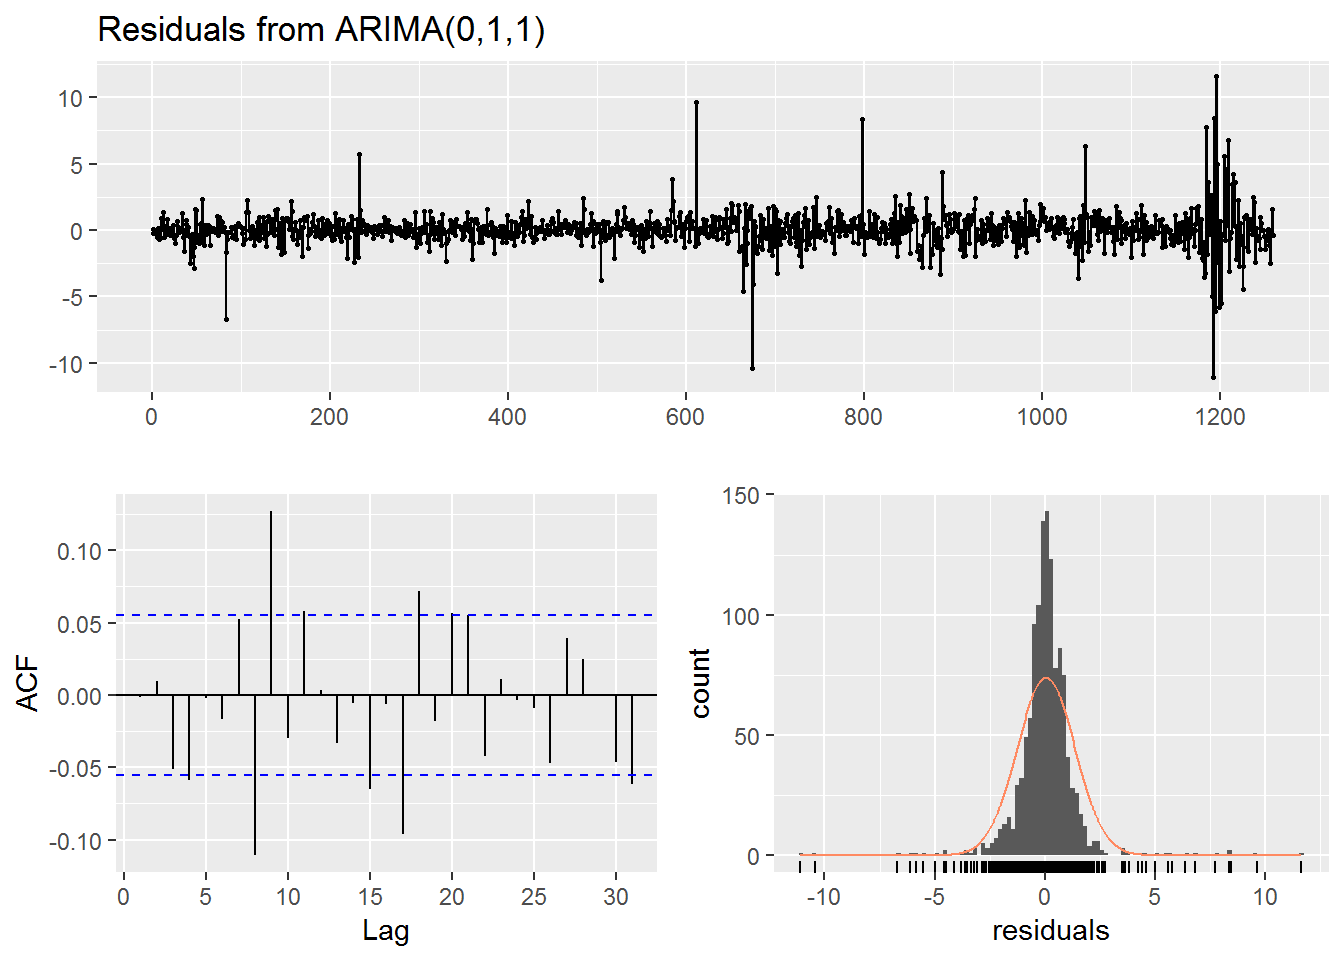
##
##  Ljung-Box test
##
## data:  Residuals from ARIMA(0,1,1)
## Q* = 48.767, df = 9, p-value = 1.835e-07
##
## Model df: 1.   Total lags used: 10
Based on the results of the Ljung-Box test neither model seems to have white noise residuals. Since the model with q=1 seems slightly closer to white noise we will use it for our forecast.
fit <- arima(walmart_xts$Close, c(0, 1, 1))

fc <- forecast(fit, h = 100) # 100 weekday forecast
autoplot(fc,
         main = "Walmart 100 Weekday Stock Forecast Since June 18 2020",
         xlab = "Weekdays Since June 18 2015",
         ylab = "Close Price")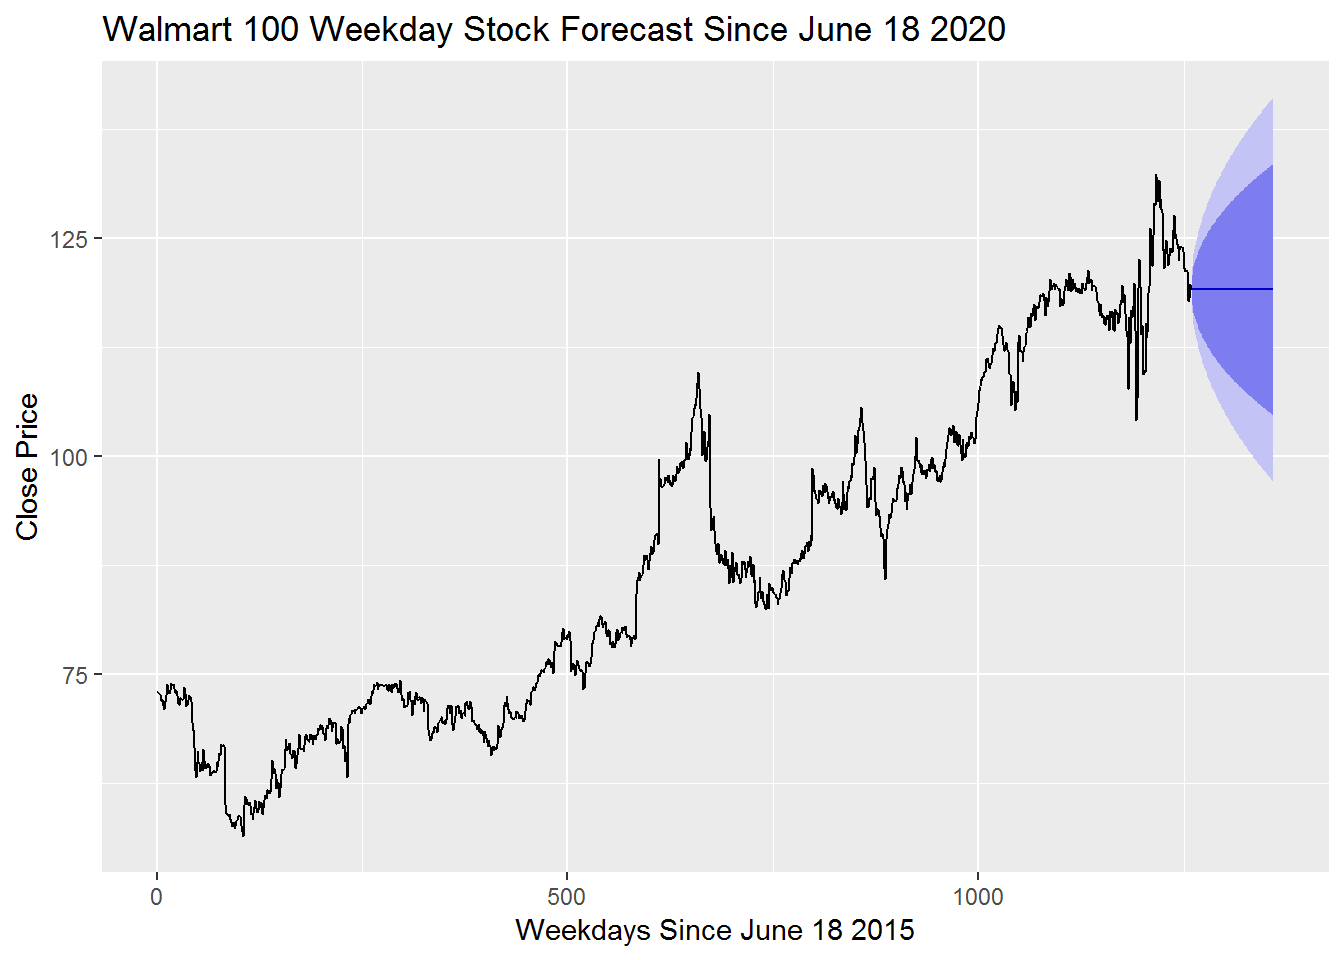
Our forecast appears to be constant. This represents that we have little clue as to whether or not the stock price will increase or decrease in the future. Our prediction intervals at 80% and 95% do give us some indication as to the risk in using this model.
Conclusion
Overall it appears that Walmart stock continues to increase in value over time. This along with mostly positive daily returns seems to indicate a good investment. Based on our forecast it is unlikely that the stock value will change drastically in a short period of time, however, we can see that large fluctuations do occur occasionally. Overall it seems like a good long term investment based on the past 5 years of stock closing prices.